Power BI for desktop is a very powerful tool and can be used to mash up data from different sources. It is definitely one up to the Excel plugins and so far seems to be more lightweight and processes things faster
I will go through my findings with PowerBI and Ax to come up with some examples
Install PowerBI: Download PowerBI for Desktop and there its a usual click install process. There are other versions available for every other device, which i will look at later. There is a detailed article on installing powerBI at c-sharpcorner.
Open up the the application and we shall create a report that looks like this
 AX Sales over time / Region
So once we open up PowerBI, select “Get Data” and select SQL server database

Enter the Database Server, if possible put the database name as well. Ax Databases being so large seems to slow down power BI.

We will now select the Tables/Views from the list. You can use the search bar and select the checkbox. Select the following Tables/Views:
- CustInvoiceJour
- CustGroup
- LogisticsPostalAddressView
After selecting the checkboxes, click the “EDIT” button in the pop up window. This will load the data preview and open the “Query Editor”
Edit Table Columns
Edit the following tables to trim the data being retrieved:
- LogisticsPostalAddressView
- Select the columns: City,CountryReqionID,RecId. Then right click and select “Remove other columns”
- CustGroup
- Select the columns: CustGroup,Name,DataAreaId. Then right click and select “Remove other columns”
- Add a computed field for identification. Click “Add Column” from the ribbon and then “Add custom column”. Set the new column name to CustGroupId and the formula as =[CUSTGROUP]&[DATAAREAID]
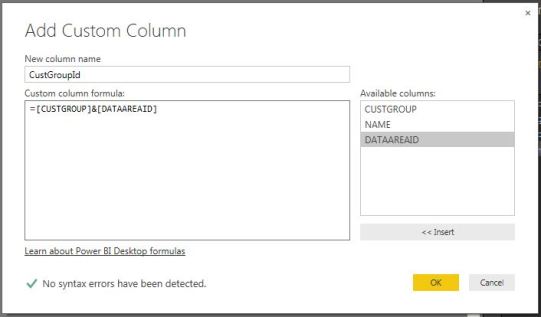
Create CustGroupId field for identification Click Ok and this field will be added
- CustInvoiceJour
- Select fields: Custgroup, OrderAccount, InvoiceAccount, InvoiceDate, InvoiceAmountMST, SalesBalanceMST, SumTaxMST, InvoicePostalAddress, CreatedBy, DataAreaId, Partition, RecId. Right click and click “Remove Other columns”
- Create a new custom column “CustGroupId” similar to the one done for CustGroup Table
- Create a new custom column “InvoiceYear”. the

Once the above is done, Select “Close and load” button, located in the “home” ribbon bar
Relationships
So now that the tables have been defined, we need to set the relationships between them. Relationships in Power Bi, just like powerview in Excel, can only be linked via one field. Hence, why we added a computed column in the tables CustGroup and CustInvoiceJour
Click on “Manage relationships”
Delete any relationships in there (Currently there is one based off the custgroupId, but we shall delete it to make sure we add it all correctly)
- Relate CustInvoiceJour > CustGroup
- Add a new relation linking CustInvoiceJour to CustGroup using the CustGroupId on both Tables.
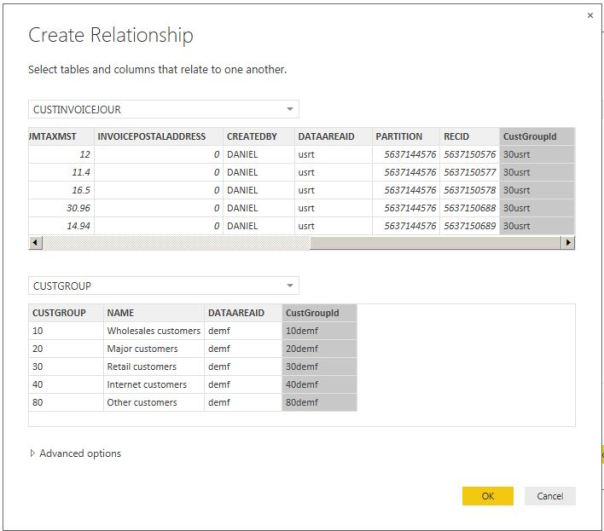
Relation between CustInvoiceJour and Custgroup
- Add a new relation linking CustInvoiceJour to CustGroup using the CustGroupId on both Tables.
- Relate CustInvoiceJour > LogisticsPostalAddressView
- Add a new Relation and related CustInvoiceJour to LogisticsPostalAddressView using the InvoicepostalAddress to the RecId. See image for details
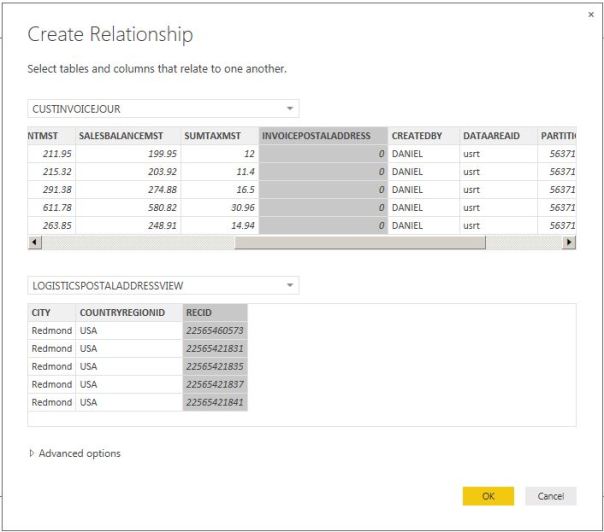
Relation between CustInvoiceJour and LogisticsPostalAddressView
- Add a new Relation and related CustInvoiceJour to LogisticsPostalAddressView using the InvoicepostalAddress to the RecId. See image for details


You should now have 2 relations setup. Close the Manage relations window and we will create our report
Creating the report
Bar Chart
in the field list at the right side of the screen, select the fields Name from the Custgroup table and then the InvoiceAmountMST field from the CustInvoiceJour Table. This will create a Table. Select the Bar chart option on the right side and it will change the view
Map
Click on a blank area in the report. From the field list select InvoiceAmountMST from the CustInvoiceJour Table and then CountryRegionId from the LogisticsPostalAddress. Then select the Map view
Sales by region over time
This will show how sales figures have been flowing by the countries
Click on a blank area in the report canvas. From the field list select InvoiceAmountMST and InvoiceYear from the CustInvoiceJournal. Make sure the InvoiceYear is on the X-Axis. Then select CountryRegionId from LogisticsPostalAddressView. Change the graph type to Line
Hoping to create more reports and make them available
Filed under: Ax 2012, BI Tagged: ax 2012, AX2012, BI, Business Intelligence, Dynamics Ax, PowerBI 


![]()
转载请注明:ww12345678 的部落格 | AX Helper » Power BI for Desktop & Ax 2012