XYZ analysis is used to categorize products based on the variance of their demand. Products with a low demand variance, i.e. same quantity demanded regulary, are categorized with X, products with an unstable demand Y and products with a high variance in demand as Z.
The categorization is based on a calculated measure, often referred to as variance coeffizient. This coefficient is calculated by the standard deviation of the demand divided by the mean.
Video
Here is a video tutorial how to build the XYZ analysis in PowerBI
Example
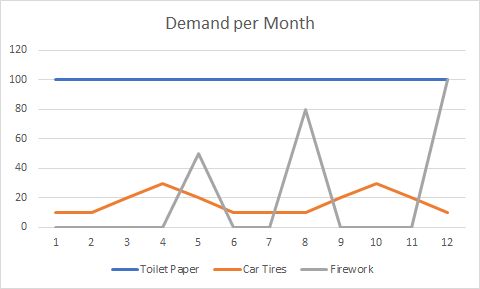
Here is an example of three products with different demand over a year. Toilet paper is needed every month in the same quantity, car tires have a higher demand in spring and autum, firework is demanded only on special ocasions.
Demand of different productsDemand of different products in a year
Prepare Data in PowerBI
The basis of the XYZ analysis will be the SalesInvoiceLines entity. At least three columns are needed. The InvoiceDate, the InvoicedQuantity and the Product Name. In this example I renamed the dataset to “Demand”
In PowerQuery create two new columns, one for the year based on the InvoiceDate and one for the month, also based on the InvoiceDate. Afterwards remove the InvoiceDate column
YEAR  = Date.Year([InvoiceDate])
MONTH = Date.Month([InvoiceDate])
Next, remove the InvoiceDate column and group the records by ProductName, Year and Month and aggregate the InvoicedQuantity column. Here is an example:
Aggreage demand by product name, year and monthAggregation in PowerBI
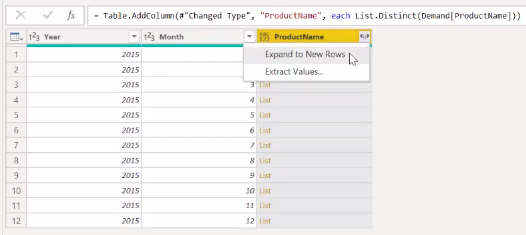
The second dataset contains the XYZ data template, including the ProductName, Year and Month. For simplicity you can enter the 12 records for Year / Month combinations manually. Add an additional column containing the distinct list of ProductNames and expand the rows.
ProductName = List.Distinct(Demand[ProductName])
Product name, year and month
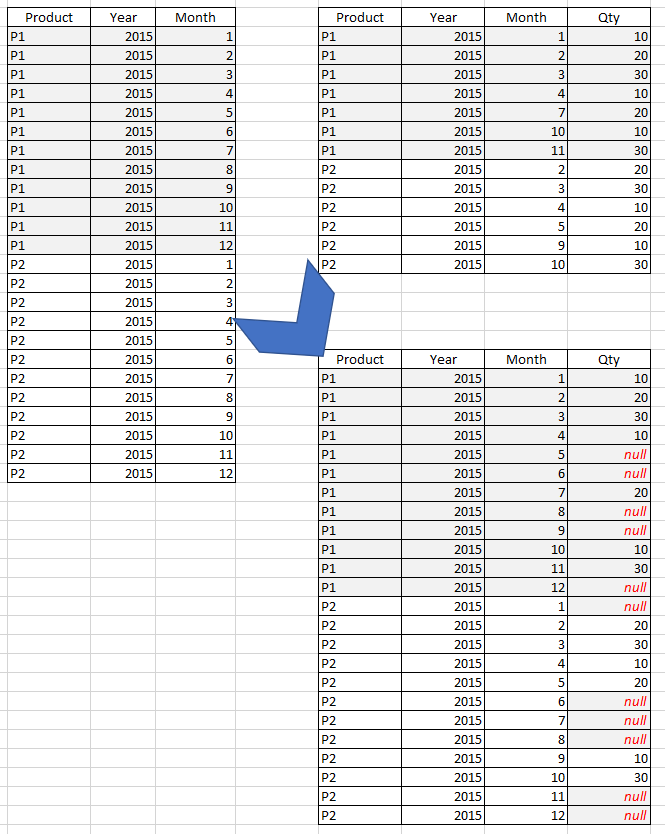
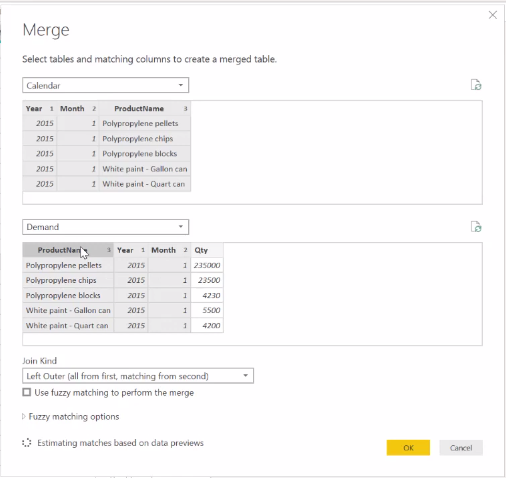
Finally, merge the two datasets to a new one using a left outer join based on the second dataset. As result you get a list of ProductName, Year, Month, Qty combination for each product and every month no matter if there was an acutal demand or not. If there was no demand, the Qty will be null and needs to be converted to 0.
Left Outer Join on calendar and demandMerge queries in PowerBI
The resulting dataset has records for eacht month and product. It can be used to calculated the mean, standard deviation and variation coefficient. To do so, create a new measure in PowerBI. It will calculate a coefficient value that can be used to categorize the products in X, Y and Z.
Variation Coefficient in PowerBI