
Purpose:
The purpose of this document is to demonstrate how to develop SSRS column chart report in Dynamics AX 2012.
Prerequisites:
- Visual Studio 2010
- Visual Studio tools.
- Reporting extension.
- Report Builder.
- Should be well-versed in Report Programming Model.
Business Requirement:
Create a column chart report to show top products sold in the year 2012.
Project Overview:

Data Analysis:

Use the above SQL query result to validate the report which shows the product IDs sorted on the quantity sold in descending order.
Development Steps:
1. Create an RDP class MAKTopProductsSoldDP. Give the definition of processReport method as follows:
[SysEntryPointAttribute]
public void processReport()
{
    MAKSalesTable   makSalesTable;

    while select ProductSold, sum(SalesQty) from makSalesTable
        group by makSalesTable.ProductSold
            order by makSalesTable.SalesQty desc
    {
        this.setMAKSalesTableTmp(makSalesTable);
    }
}
2. Create a new method setMAKSalesTableTmp and give the following definition:
private void setMAKSalesTableTmp(MAKSalesTable _makSalesTable)
{
    makSalesTableTmp.clear();

    makSalesTableTmp.ProductSold = _makSalesTable.ProductSold;
    makSalesTableTmp.SalesQty = _makSalesTable.SalesQty;

    makSalesTableTmp.insert();
}
3. Create a new method getMAKSalesTableTmp and give the following definition:
[SRSReportDataSetAttribute(tableStr(MAKSalesTableTmp))]
public MAKSalesTableTmp getMAKSalesTableTmp()
{
    select makSalesTableTmp
        order by SalesQty desc;
    return makSalesTableTmp;
}
4. Open Visual Studio 2010 and create a new project of type Report Model, MAKTopProductsSold choosing Microsoft Dynamics AX from installed templates.

5. Add new Report MAKTopProductsSold to the Project node in the Solution Explorer.
6. Add new Precision Design to the Designs node of the report.
7. Right click the precision design and click Edit Using Designer.
8. Drag Chart from the Toolbox.
9. Set Chart axes properties appropriately to show Products on the X-Axis and Quantity on the Y-Axis.

10. Improve formatting of the chart using some professional intellect :)
11. Deploy the report to the Report Server using Microsoft Dynamics AX 2012 Management Shell.

12. Create a new controller class MAKTopProductsSoldController and give the following definition for the main method:
static void main(Args _args)
{
    MAKTopProductsSoldController    controller;

    controller = new MAKTopProductsSoldController();
    controller.parmReportName(ssrsReportStr(MAKTopProductsSold, PrecisionDesign));
    controller.parmArgs(_args);
    controller.parmShowDialog(false);
    controller.startOperation();
}
13. Create a new output menu item MAKTopProductsSold to point it to the controller class. Sets its properties as shown below:
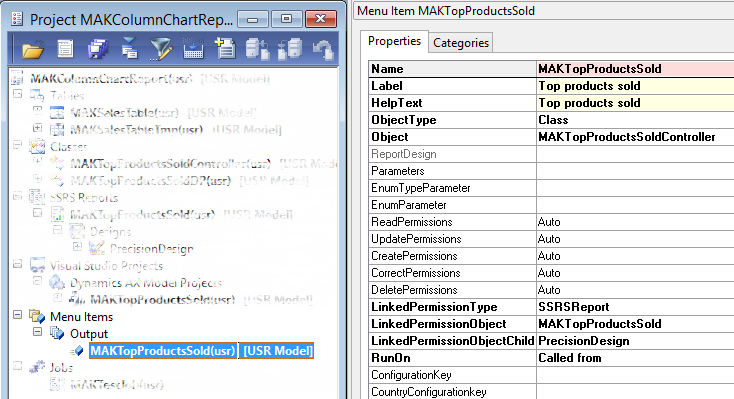
14. Run the report using the output menu item. Notice that the report dialog has been suppressed by the controller.
15. You should be able to see the report in action :)
