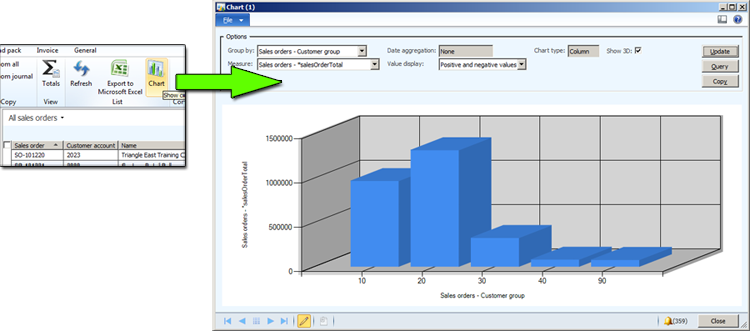
Charting sales order total by customer group for specific date range
It has the following features:
- Generate a chart from any form by adding a single menu-item reference. Table structure and field metadata is generated automatically and filters are maintained.
- Group and measure by any available field or data-method. Joined tables are available.
- Automatic date aggregation when grouping by a date field or method (week, month, year/month, etc)
- Copy to clipboard for import into other documents.
The control is fairly basic at this stage. Additional nice-to-have features that may be included later on include:
- Load/save for query and chart setup
- Export directly to file
- Multiple grouping and measures per chart
- Additional aggregate functions (average, min/max, etc).
- Better linking for joined tables and tables related by surrogate keys *
Any display method can be used for grouping or measures. For example, if you add a display method to SalesTable called "salesOrderTotal", this can be immediately referenced as a measure on the chart. If information is required from a related table (eg customer group name when charting sales order information), you can add another display method to return the required attribute.
If the table contains a field group called ChartFields, then only the fields and methods included in that group will be available in the charting form. Otherwise, all fields and display methods are selectable.
Installation
The installation is relatively straightforward but you may need a developer for a couple of steps. If you have any questions or get stuck feel free to post a comment.1) Unzip the archive, then run the AxSimpleChartSetup installation package.
2) Import SimpleChart.xpo using the AOT
3) Add the menu item SimpleChart to any forms you want to add the charting functionality to. Generally this would be placed next to the standard "Export to Excel" option on list pages. eg:
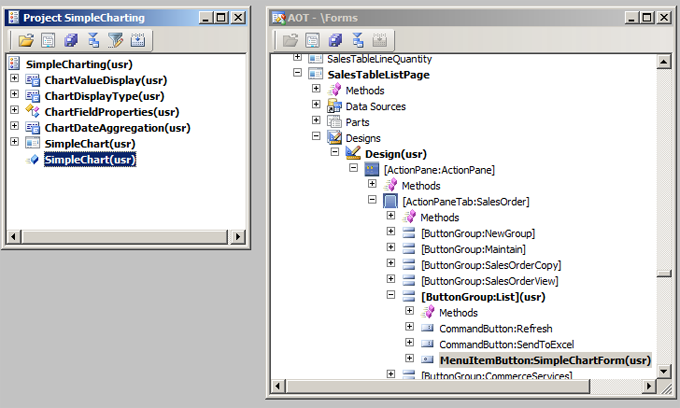
On the form button control, you'll probably want to set the Big and MultiSelect properties to Yes.
Using the charting add-on
The chart will use the same query as the form you opened it from. If you've multi-selected records, it will be limited to your selection.Select a group field for the x-Axis, and a measure field for the y-Axis. (NB the axes may be rotated when viewing different chart types). Click Update to refresh the results.
When selecting a date field for the grouping, you have the additional option of aggregating date values by week number, month name, etc. This could be used for example to show total sales by month for a specified date range.
Methods can be specified for grouping and measures, but they must be nominated as a display method. Be mindful that the chart will execute the method for every matching record in the datasource - This could take a significant amount of time depending on the operation.